


Another One For My Picture Lovers! The Best Charts/Graphs/Visualizations From This Week | (1.13.23)
“It’s not because things are difficult that we dare not venture. It’s because we dare not venture that they are difficult.” - Seneca

The Best Charts/Graphs From This Week:
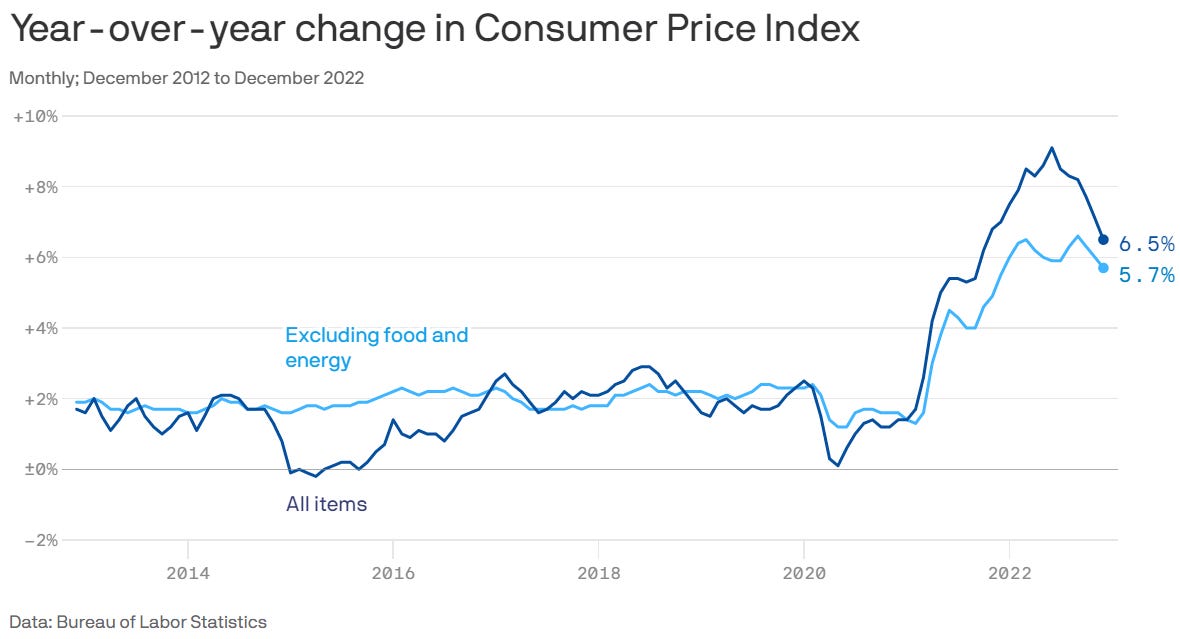
• As forecasted by the market, YoY CPI came in at 6.5% (5.7% excluding food & energy). The inflation decline resumes as the economy continues to slow.1
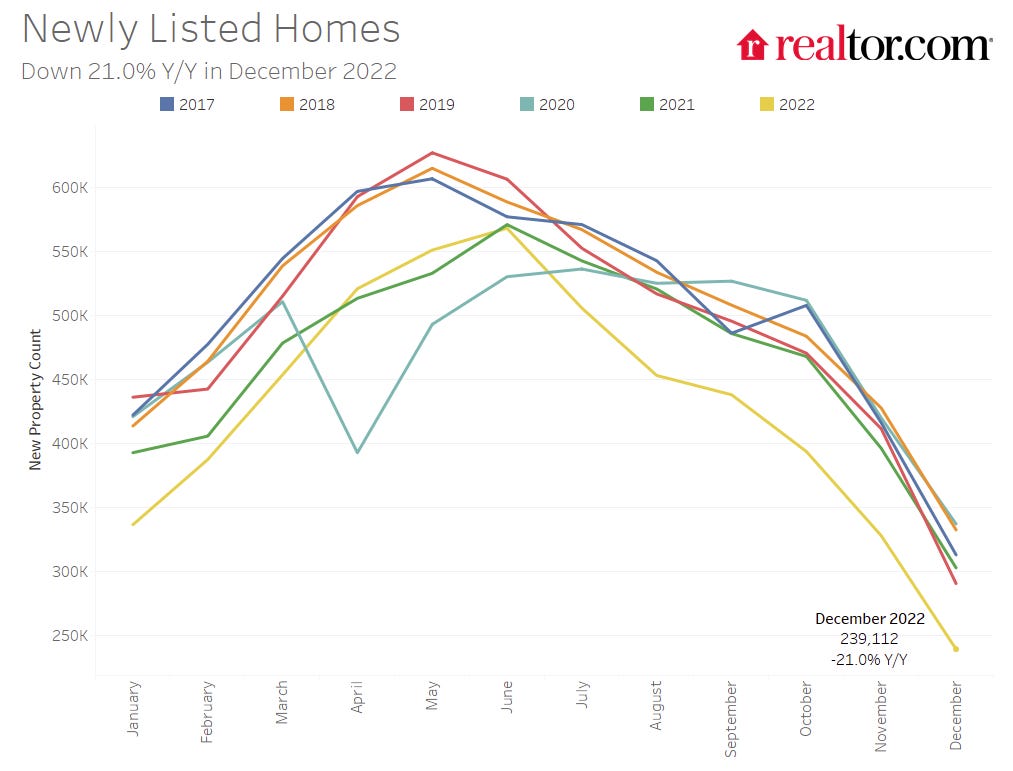
• According to the below graph from Realtor.com’s December Housing Trends Report, new listings were down about ~21% year-over-year in December 2022.2
• Despite the decline in new listings, YoY inventory was still up 61.4% (the red dot) in the first week of January 2023 compared to the same week in 2022. It does remain below 2019 levels (black line), however.3

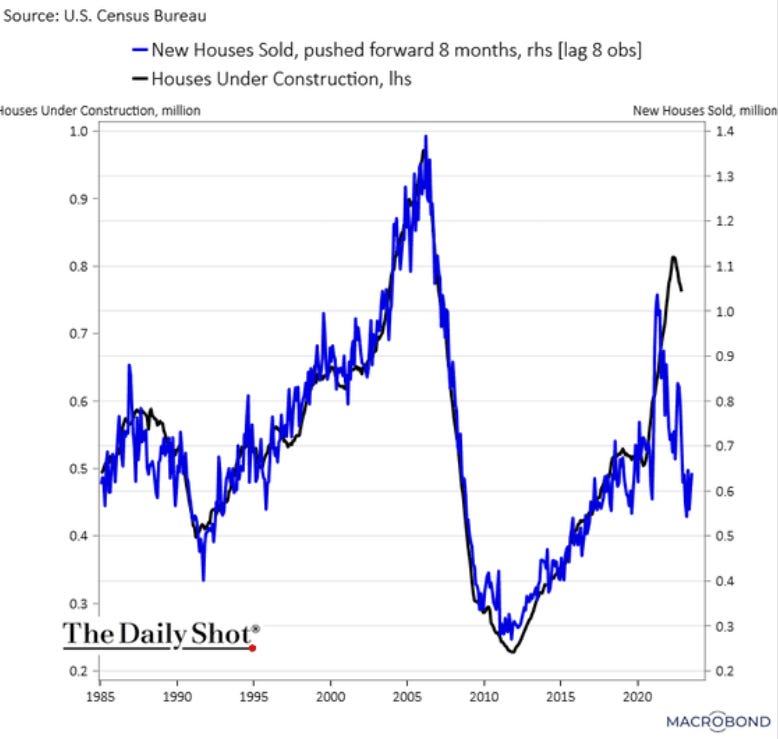
• Lastly on the real estate front, below is a comparison of new home sales vs. houses under construction.4
• What do varying experts across different fields think 2023 will look like? See below:5

Tweet Of The Day:
• AI will change our lives in the next 5 years more than any other technological advancement we’ve seen in the past 15 years…6

Source: Realtor.com — December 2022 Monthly Housing Market Trends Report.
Source: CalculatedRisk Newsletter.
Source: VisualCapitalist.com — Prediction Consensus: What the Experts See Coming in 2023.
Source: Twitter — @AlexHormozi.