


Correct, You Still Cannot Blindly Trust Unemployment Rate Headlines. Everything You Need To Know Heading Into The Weekend. | (1.6.23)
“Things are not always what they seem; the first appearance deceives many; the intelligence of a few perceives what has been carefully hidden.” - Phaedrus

What You Need To Know Today:
• This morning we received an updated unemployment rate from the U.S. Bureau of Labor Statistics (“BoL”) which showed a slight move down to 3.5% during the month of December — coming in lower than the pre-report market expectation of 3.7%.1 With this reading, the narrow range of 3.5-3.7% that we’ve seen since March 2022 continues. Additionally, the BoL (Business Survey) reported 223,000 job created in December, which was stronger than the market expectation of 200,000. When reviewing the figures from this report is it important to remember that the full report is made up of two surveys: (1) Business Survey & (2) Household Survey. The Business Survey is where the headline figure for job creations is derived whereas the unemployment rate comes from the Household Survey. With that being the case, let’s take a deeper look into the Household Survey which has its own job creation component and how it relates to the current unemployment rate. According to this portion of the report, there were 717,000 job creations in December, out pacing the 439,000 increase in the total labor force — causing unemployment to decline. However, there is always more to the story than the headline will lead you to believe if you dive deeper into the data. For example, of the 717,000 job creations 679,000 (94.7%) were from part time jobs and only 38,000 (5.3%) were representing full time roles. This was likely influenced heavily by seasonal hiring around the holidays. Further, 380,000 (52.9%) of the total 717,000 jobs were filled by “multiple job holders” most of which is captured in the part time figure and represents individuals taking on multiple roles in order to stay financially afloat. When we really take a deeper look at the data and read between the lines a bit, is this jobs report really as positive as the mainstream media headlines would lead you to believe?

TL;DR — Once again unemployment headlines paint one picture, but a deeper look into the data paints another.
• We also received updated average hourly earnings figures from the BoL this morning which had a month-over-month increase of 0.3% — less than the pre-release market expectation of 0.4%. Over the pat year, average hourly earnings have increased by 4.6%, which would be excellent…. if they weren’t being outpaced by inflation (as per below).2
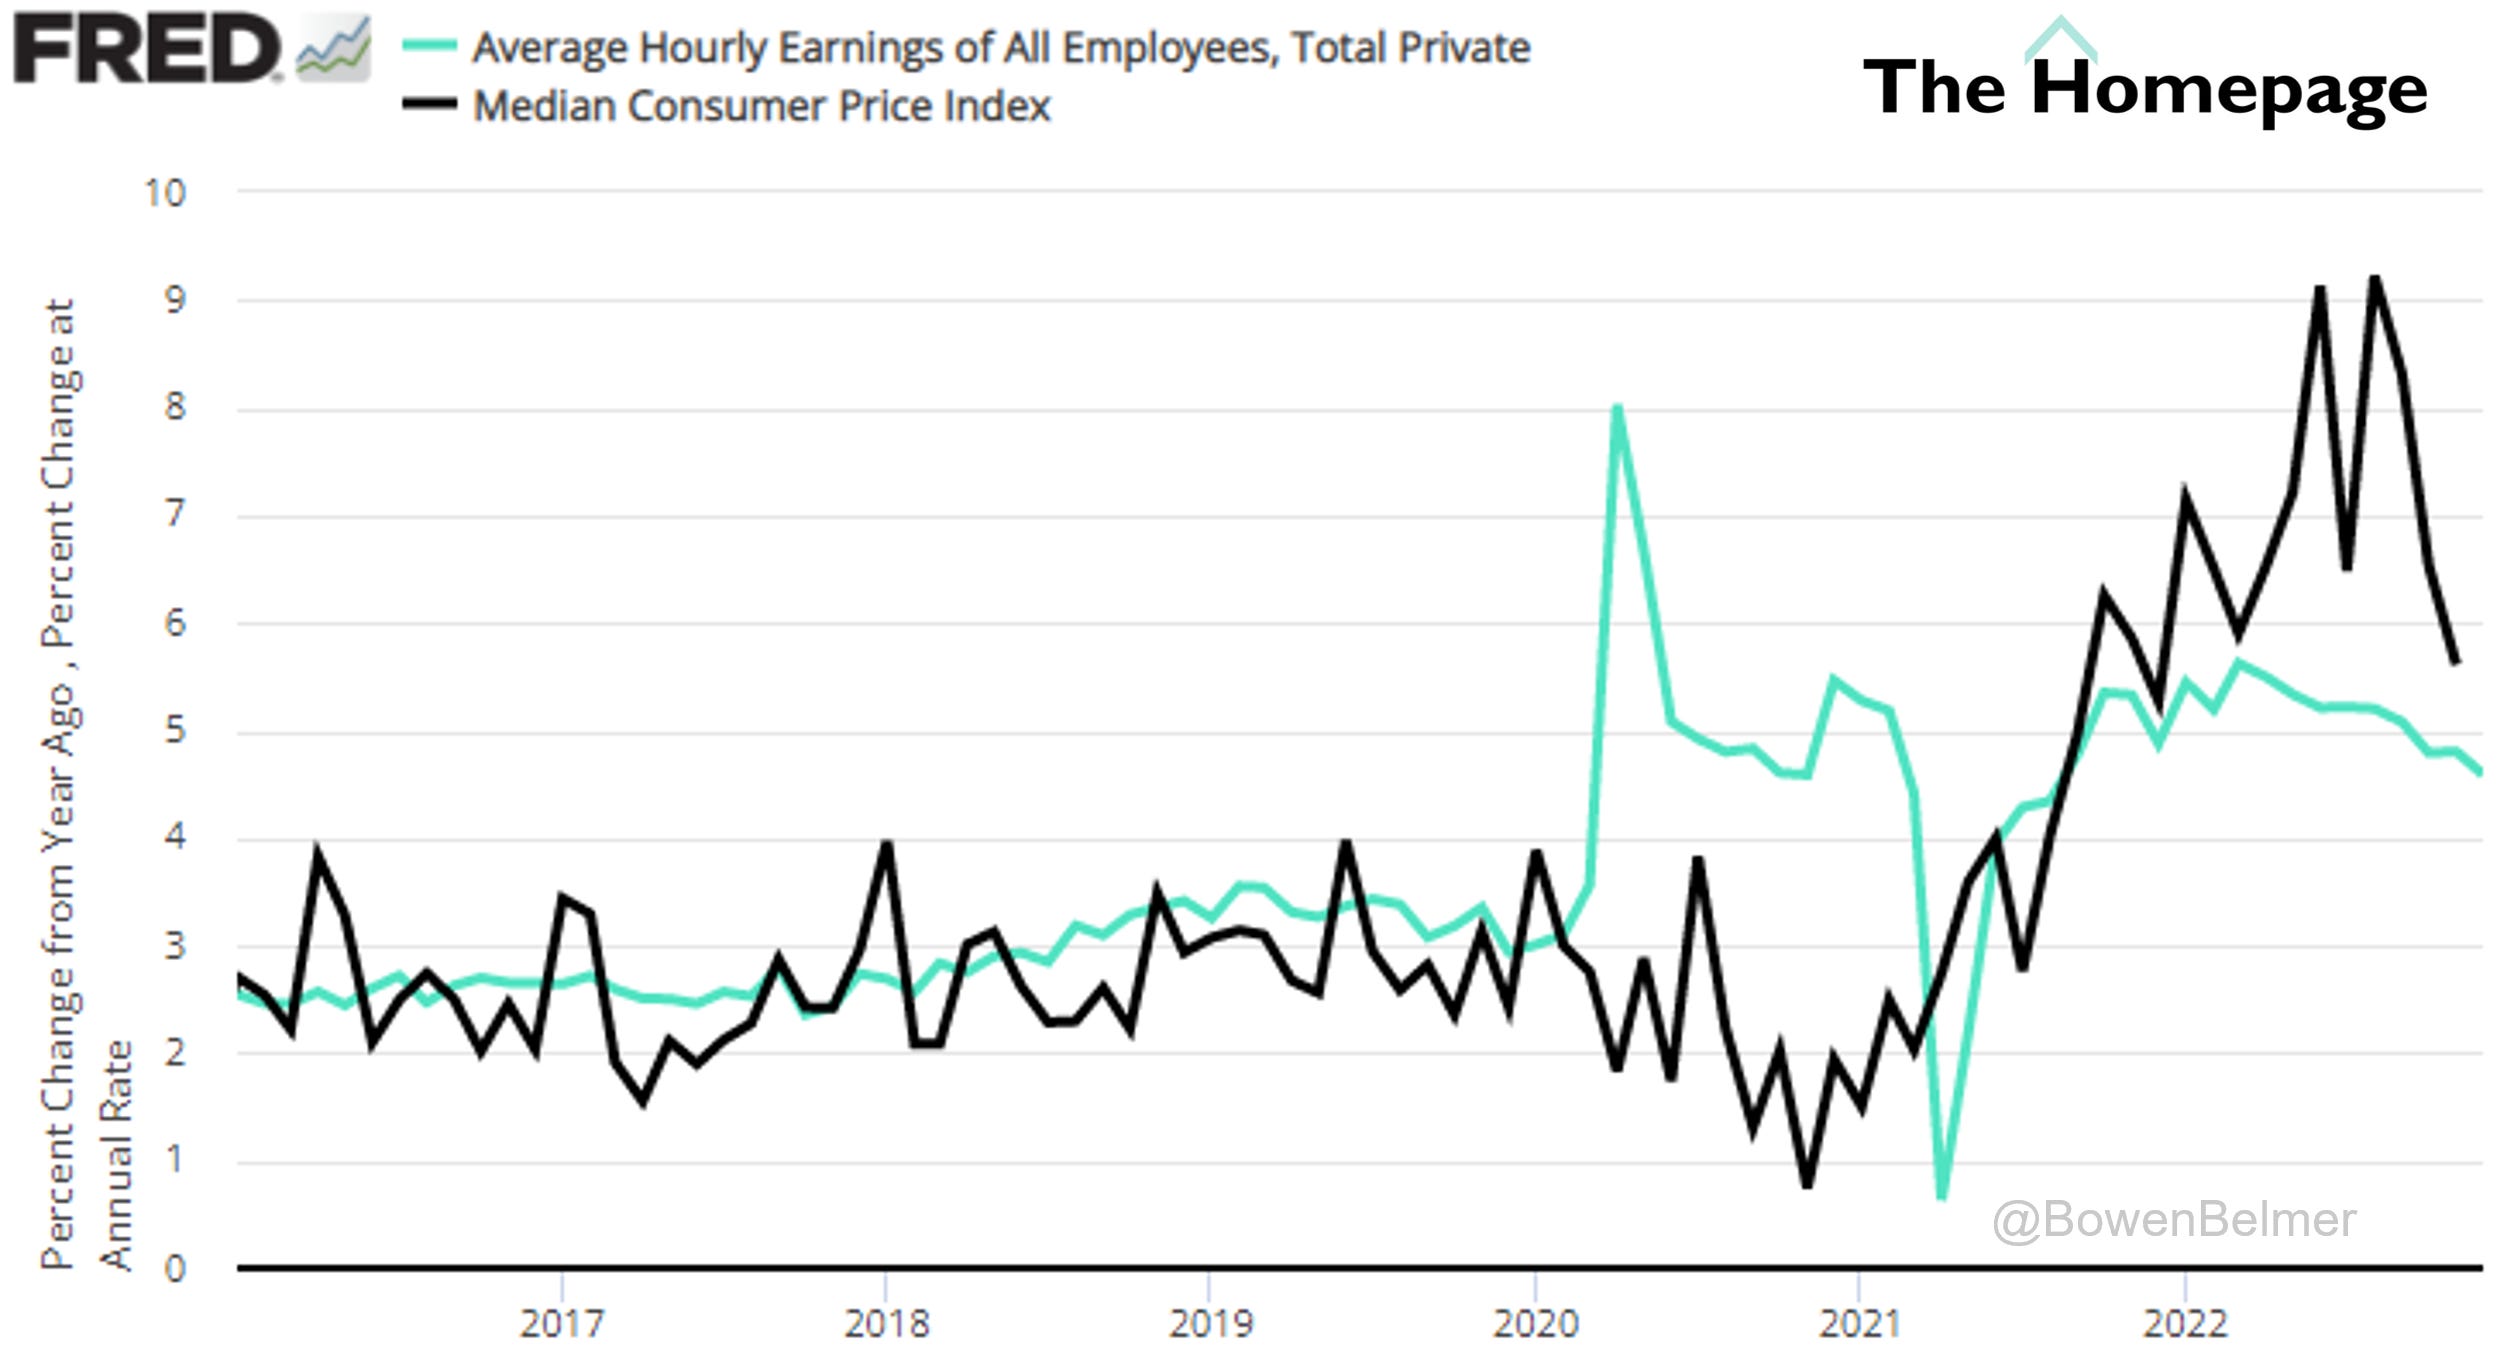
TL;DR — Wage growth was relatively strong in 2022… just not relative to inflation (CPI).
• According to research from YouGov, just 37% of Americans set an official “resolution” or personal goal for 2023 (with 17% indicating that they are unsure).3 Goals around physical well-being were set for a similar proportion of people across generations with approximately 20% of adults aged 18-29 and 65+ indicating that they would like to exercise in the new year. By looking past physical health we see a significant difference between younger and older Americans. For instance, about 1/4th of responders 30 years old or younger set “being happy” as their main goal compared to just 10% of those over 65. This seems to be the case for a lot of the answers that could fall under the category of “self-improvement.” From one perspective, this indicates that the younger generation is more focused on improving themselves which could be viewed as a positive. However, looking at these answers from a different perspective, it can also indicate that those ages 65+ have a higher level of life-satisfaction — which can also be easily viewed as a positive.
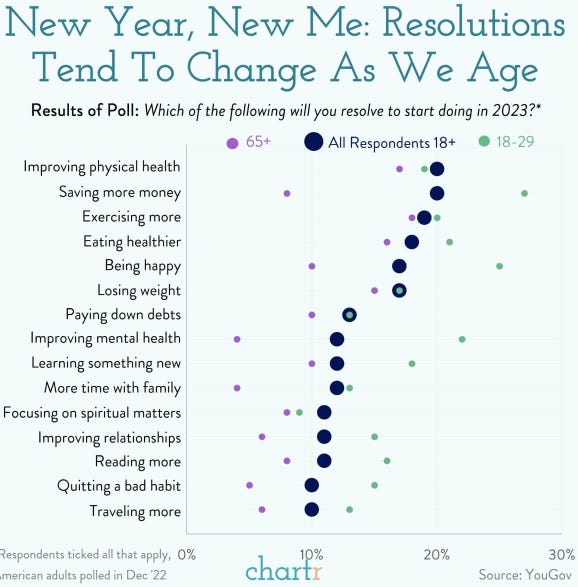
TL;DR — Americans of all ages are focused on improving physical health in 2023, but there seems to be a generational divide in other responses related to self-improvement & general satisfaction.
Chart Of The Day:4
The below provides interesting perspective regarding the difference in home sizes across the United States and as anybody who has heard me speak publicly before knows, I am a sucker for a good median (vs. an average). Wisconsin came in much lower than I would have anticipated. Does the median for your home state surprise you?:

Source: U.S. Bureau of Labor Statistics — Employment Situation Summary.
Source: U.S. Bureau of Labor Statistics, Average Hourly Earnings of All Employees, Total Private [CES0500000003], retrieved from FRED, Federal Reserve Bank of St. Louis; https://fred.stlouisfed.org/series/CES0500000003, January 6, 2023. Federal Reserve Bank of Cleveland, Median Consumer Price Index [MEDCPIM158SFRBCLE], retrieved from FRED, Federal Reserve Bank of St. Louis; https://fred.stlouisfed.org/series/MEDCPIM158SFRBCLE, January 6, 2023.
Source: YouGovAmerica / Chartr— What are Americans' New Year's resolutions for 2023?.
Source: Visual Capitalist — The Median Home Size in Every U.S. State in 2022.