


Data Shows Realtor Commissions Slashed Post-NAR Settlement — The New Equilibrium Or Lower From Here? (Homepage #49 🏠)
“The ballot is stronger than the bullet.” – Abraham Lincoln

Let’s Get You Up to Speed On Some Market Insights That Matter:
Without a doubt, one of the most discussed topics within real estate over the past year has been realtor commissions and the potential impacts of the NAR settlement decision. For the first time, I see data highlighting how commissions have been impacted so far. According to RSIMedia, agent commissions have fallen 68 bps (0.68%) since the new regulations went into effect1. Interestingly, their report shows a more even decline than most would have anticipated, with buy-side commissions falling from an average of 2.65% to 2.28% (-37 bps) and listing-side commissions declining by 31 bps on average, respectively. Over time, we can all expect the market to find a new equilibrium; the question is — how far down do average commissions for agents slide between now and then? Additionally, this data raises further questions about the distribution of commissions paid by the seller or the buyer and how this may have also changed. We will report back on this once more information is available.
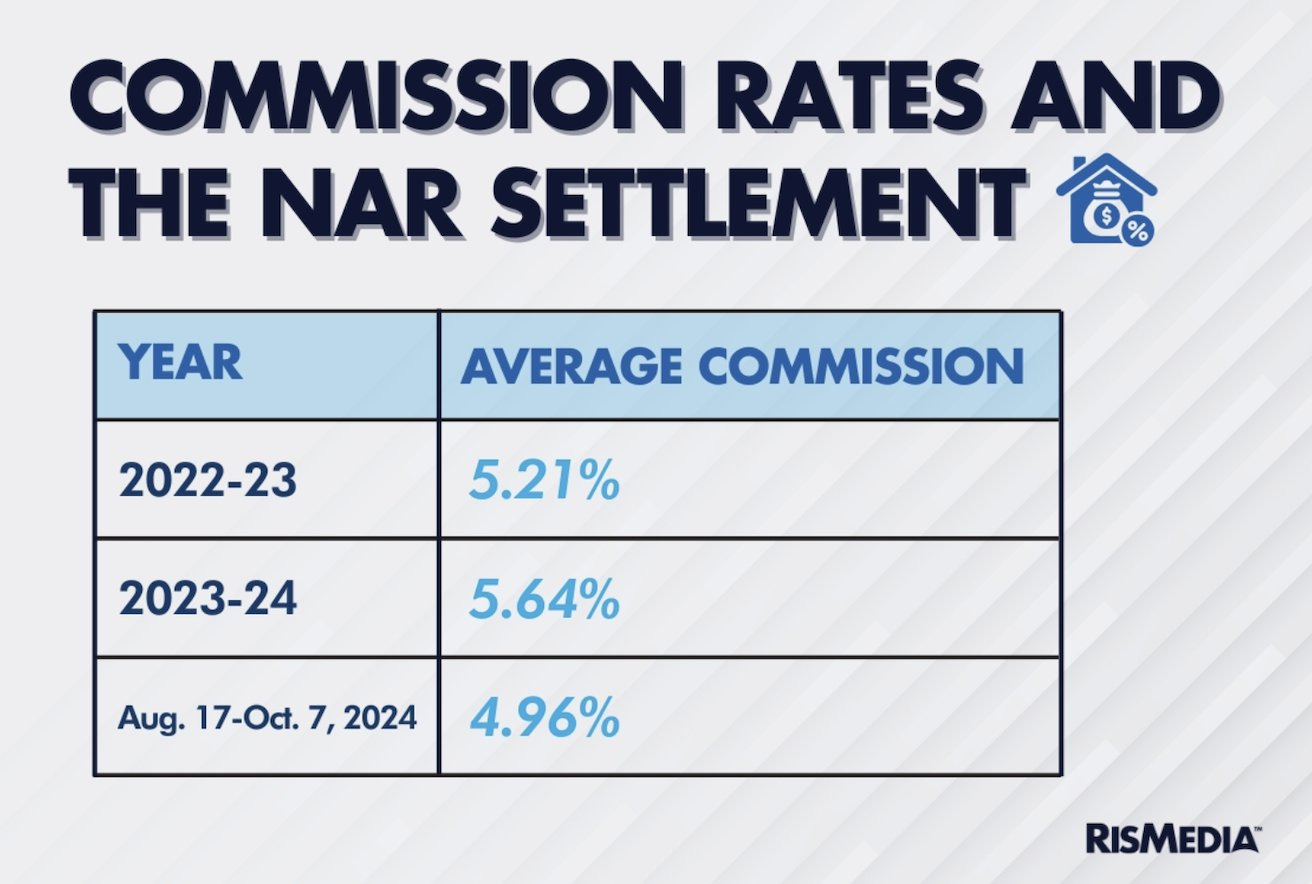
TL;DR — We are beginning to see the first bits of data surrounding the NAR settlement’s impact on realtor commissions. So far, the have slid between -37 bps and -31 bps on average.
30-year fixed-rate conventional mortgage rates have once again surpassed the 7.00% mark, sitting at ~7.09% at the time of writing, marking a 4-month high.2 This sharp movement officially wipes away the rate relief seen between July – September due to the market pricing in the highly anticipated September Fed rate cut as well as the (at the time) anticipated further rate cuts ahead of year-end. Meanwhile, while this morning’s updated jobs report (including unemployment figures) looked as though it could potentially lead to a sharp market reaction, the figures came in at market expectation (4.1% unemployment), so a drastic move is unlikely. Concurrently, next week’s election still presents the potential for considerable bond movements depending on how the results are received by market participants.
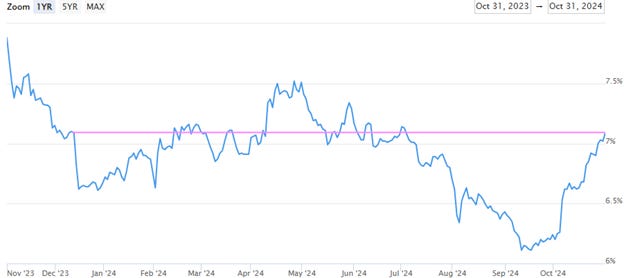
TL;DR — Mortgage rates are sitting at 4-month highs with the continued election uncertainty looming.
According to Realtor.com data, active housing inventory continues to rise compared to the past four years but still lags behind pre-COVID levels.3 The chart below serves as a solid graphic representation of the market “vibe” shift we are all experiencing. Yes, we are still in a “seller's market” on a national scale from a technical perspective (with some outliers like Florida). However, we are trending closer and closer to returning to a “buyers' market,” and the scales have tipped some. Based on the general “vibe shift” that has already been taking place on social media platforms, it seems as though we are ~16% away (inventory of 1.1M or 2017 levels) from most, believing the market dynamic has officially “flipped.”
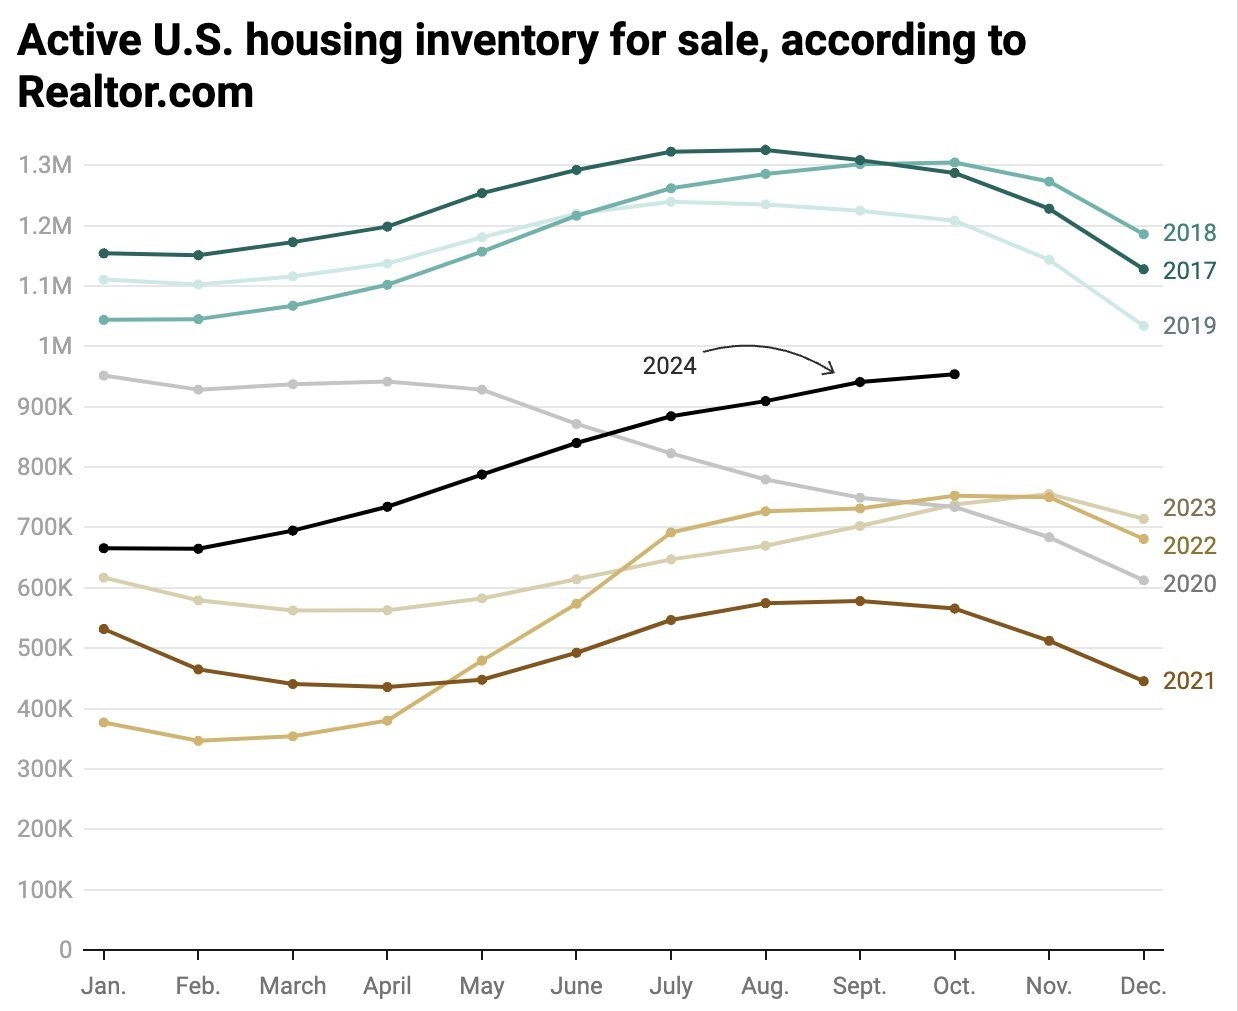
TL;DR — Active U.S. housing inventory has reached 4-year highs and continues to trend towards a market dynamic shift in favor of buyers.
Map of The Day:
Wisconsin readers, are you feeling as though your phone is being completely bombarded with political calls, texts, emails, telegrams, tweets, snail mail, and pony express letters—to the point at which you want to throw your phone in the microwave, then freeze it in a bucket of hotdog water, only to ultimately smash it with a sledgehammer, set the crumbled pieces on fire, and bury them? No? Just me? …well, it turns out the insanity might be for a reason, as since 1960, Wisconsin has had more presidential elections determined by a margin of victory of <5% than any other state.4
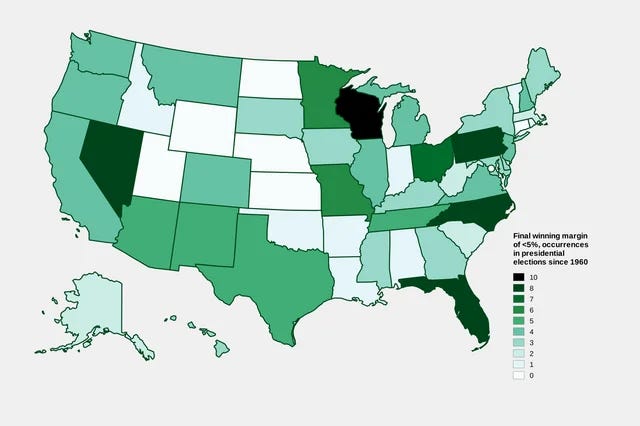
TL;DR — It turns out Wisconsin is quite the outlier when it comes to being a presidential election swing state. Get out and vote, people!
Thank you for reading another issue of The Homepage!
Is there a specific type of content you’d love to see covered by The Homepage? Let us know. We are always open to suggestions as to how we can make this newsletter the best possible source of real estate/economic information each week.
Source: Mortgage News Daily.
Source: Realtor.com data.
Source: U.S. Election Atlas data.