


Here Is Your Bank Holiday Multi-Chart Data Special! | (12.26.22)
"Vitality shows in not only the ability to persist but the ability to start over." - F. Scott Fitzgerald

The Best Charts I Saw This Weekend:
Housing price growth from January 1975 - July 20221

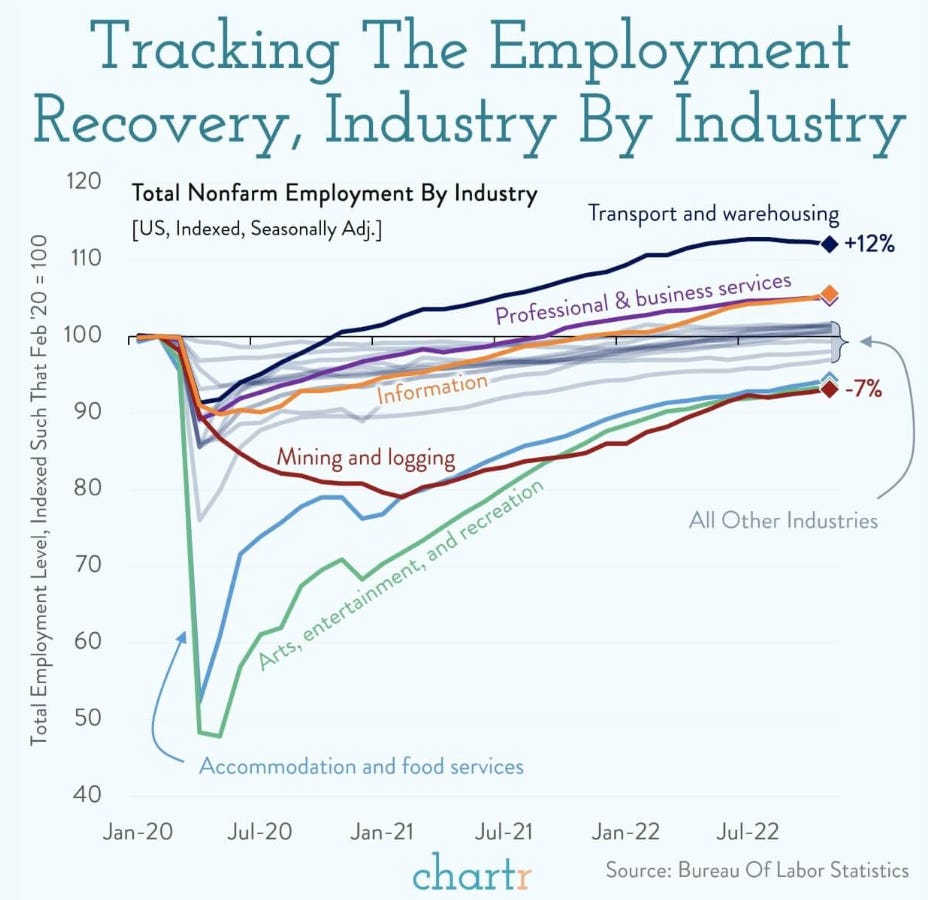
Employment nearly recovered from the COVID-19 pandemic, but we can expect to see some of these lines fall off once again as monetary policy remains tight and the economy continues to slow.2

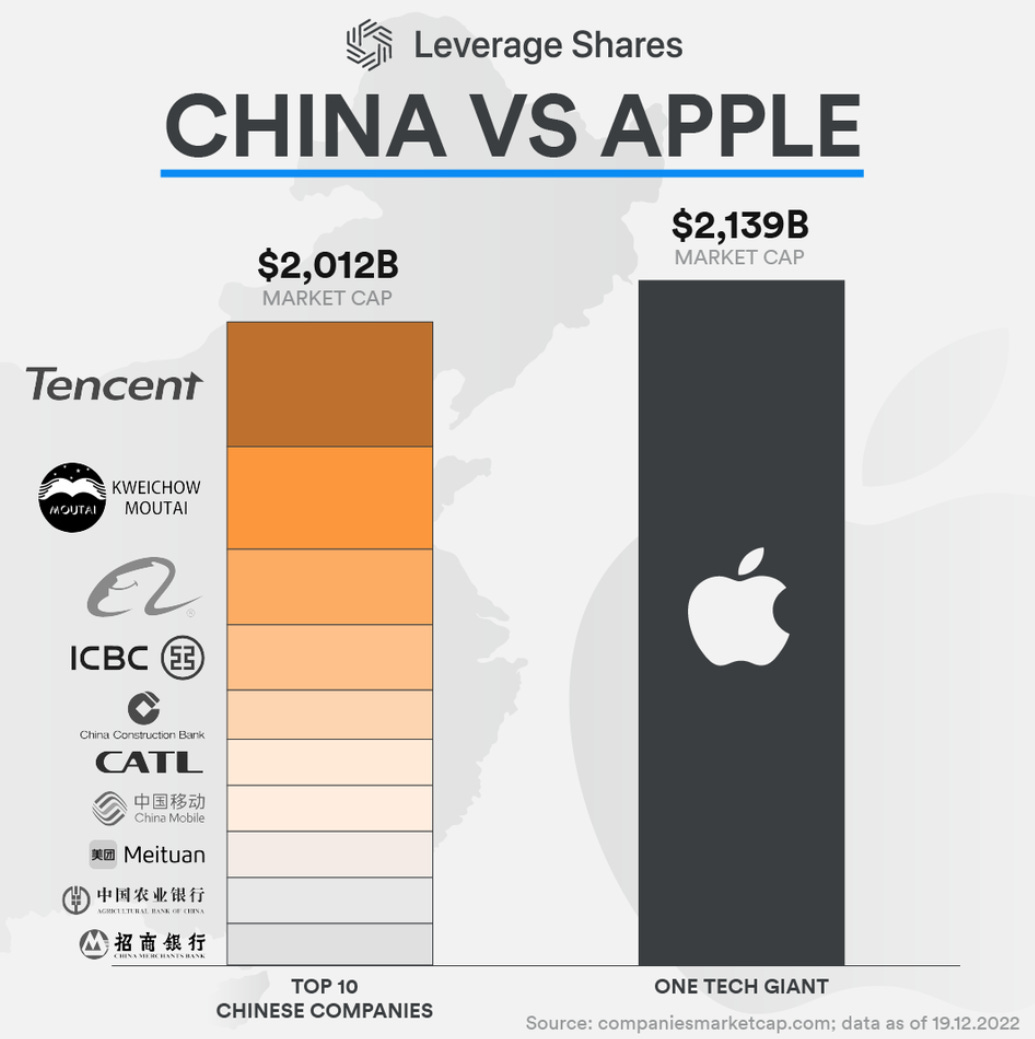
Apple has a larger market cap than China’s top ten largest companies.3

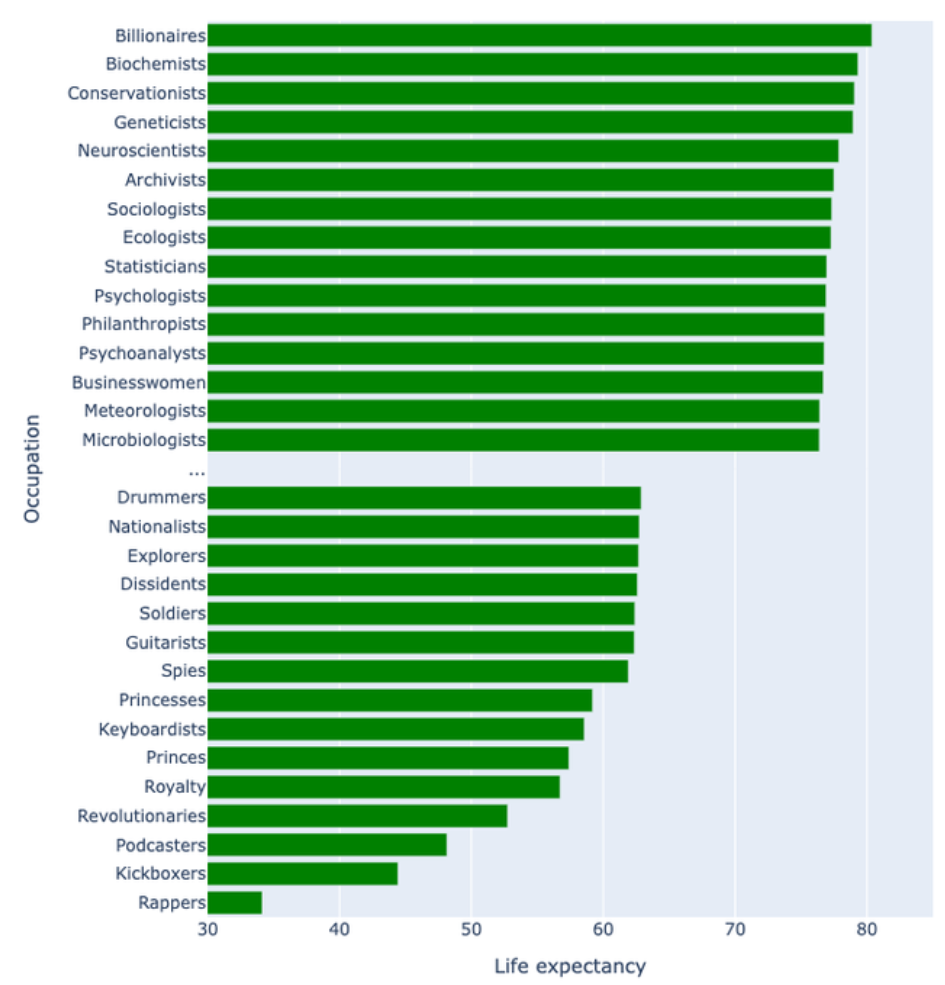
Life expectancy by “occupation” based on individuals within a given field that have a Wikipedia page. I believe there is a decent amount of skew in this data for the “newer” professions who might not have had many individuals live long lives and then pass away yet given that according to this data podcasting is more dangerous than being a soldier or spy.4
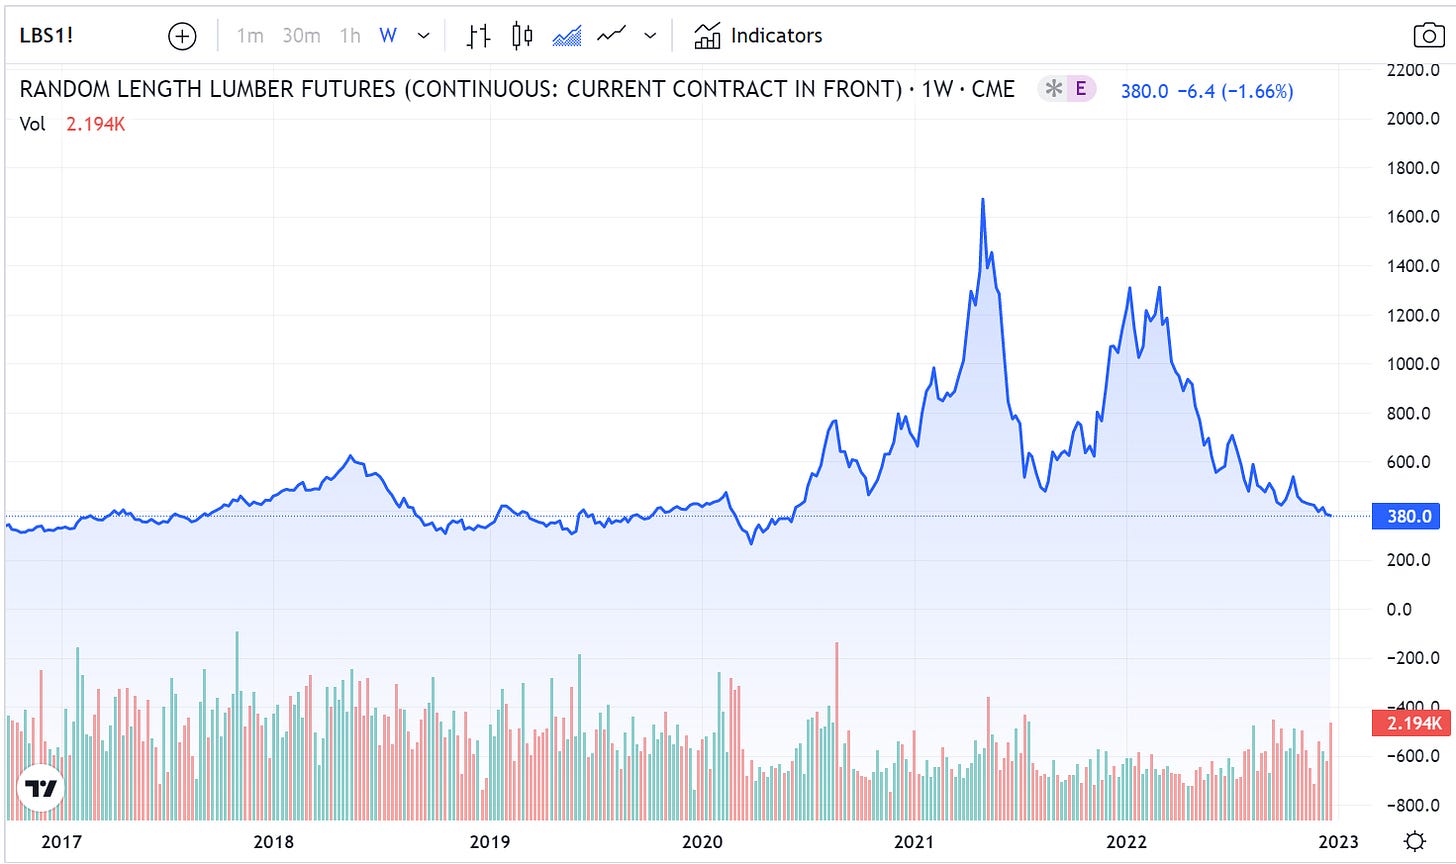
Lumber futures have returned to Pre-COVID-19 pandemic levels. In theory, this implies that the cost of new construction should come down. The question is, will we see this play out in reality?5


DeFi “alt-coin” total market cap currently sits just below all-time lows relative to Ethereum. Long-term DeFi bulls are salivating at the buying opportunity in front of them.6


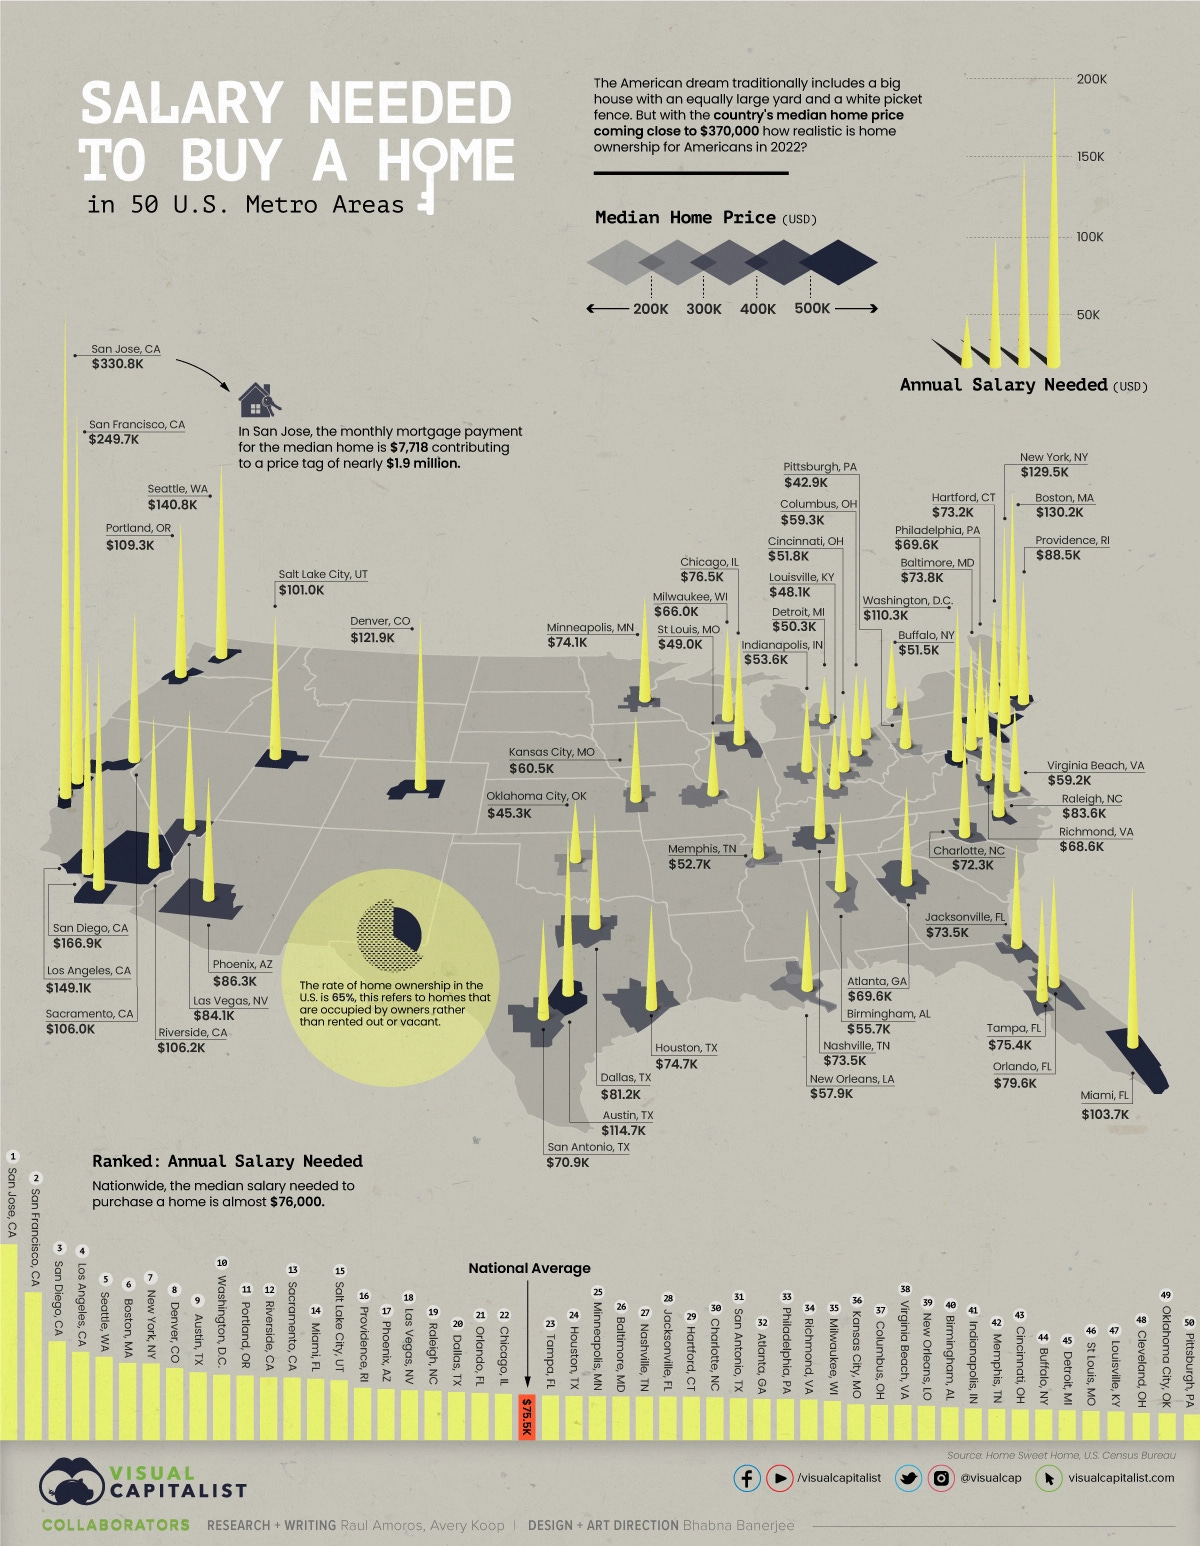
Food for thought regarding the cost of living across the United States.7
Twitter Exchange Of The Moment:8


Source: FHFA Housing Price Index Data
Source: Bureau of Labor Statistics — https://www.chartr.co/
Source: https://companiesmarketcap.com/
Source: https://www.wikipedia.org/
Source: Trading View — CME Lumber Futures
Source: Messari Research
Source: Visual Capitalist — The Salary You Need to Buy a Home in 50 U.S. Cities.
Source: Twitter.com — @MrBeast