


Home Inventory Is Not Where You Think It Is. Also, The Market Is More Aggressively Pricing In Rate Cuts| (1.27.23)
Home Inventory Is Not Where You Think It Is. Also, The Market Is More Aggressively Pricing In Rate Cuts| (1.27.23)
"It's attention to detail that makes the difference between average and stunning." - Francis Atterbury

What You Need To Know Heading Into The Weekend:
• One of the biggest stories of the week was the release of advanced quarter-over-quarter U.S. GDP for Q4 2022 from the Bureau of Economic Analysis which came in at an annual rate of 2.9%.1 This figure beat the pre-release market expectation of 2.6% and quite frankly is a direct contradiction to current recessionary fears. Is this a sign that the Fed will succeed in their “soft landing” after all? Or, are we still just drifting closer to the recessionary catastrophe many economists are calling for?
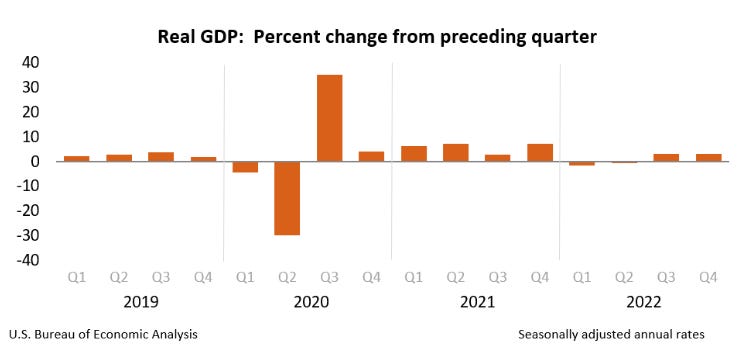
TL;DR — GDP came in more positive than expected. Flashing signals that an economic “soft landing” could be possible? Maybe?
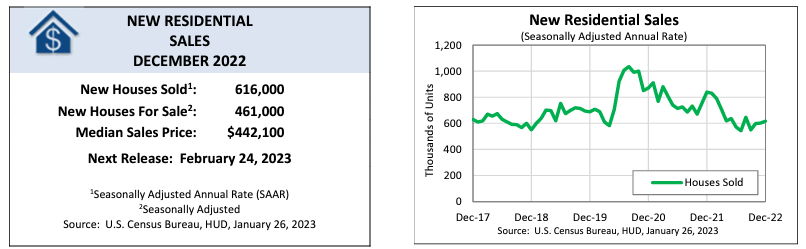
• The United States Census Bureau published monthly new home sales figures for December 2022 which measure the annualized number of single-family homes sold during the month. Essentially, this means that the reading is derived by taking the number of monthly sales across the U.S. and then multiplying it by 12. For December 2022 this figure came in at 616,000 sales which was greater than the pre-report market expectation of 610,000.2 It is also a notable improvement over November which recorded an annualized figure of just 602,000 home sales. Additionally, and as per the below graphic, the seasonally-adjusted estimate of new homes for sale at the end of the month was 461,000 — indicating a supply of 9.0 months at the current sales rate. While on a local scale many are still feeling the impacts of low inventory, at the national level inventory has made a strong bounce back from the 2020 lows of just 3.3 months.
Monthly Supply of New Houses In The United States:3
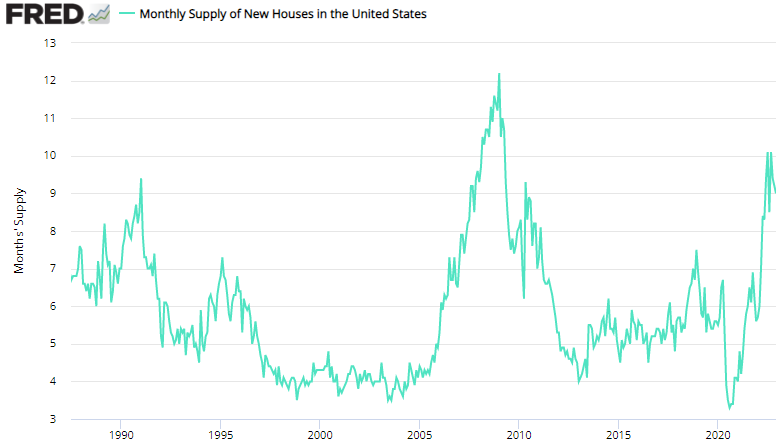
TL;DR — New home sales have returned to near-2019 levels and on a national scale inventories have bounced back significantly since COVID-19 Pandemic era lows.
• The National Association of Realtors published the latest month-over-month pending home sales figures for December 2022 showing an increase of 2.5%.4 This ends the six-month streak of decline for national pending home sales which started in May 2022. As always though, the headline does not tell the whole story for more localized real estate markets. For instance, while the “Southern” and “Western” regions of the U.S. saw increases in pending home sales to the tune of 6.1% and 6.4%, respectively, the “Northeast” and “Midwest” regions saw declines of (-6.5%) and (-0.3%). This serves as a strong reminder that just because a “net figure” on the national scale points the market in a specific direction, it does not mean that your local market is following suit. It is highly important for you to dig deeper into these reports to understand how they actually impact your local market. Or….you know… let me do that research for you and just keep checking back into The Homepage.
TL;DR — The headline pending home sales figure tells us that the six-month decline has ended, however, this is not true in all regions.
Chart Of The Day:5
Over the past month, the market has grown more optimistic about Federal Funds Rate cuts. It is now pricing in faster-paced cuts as well as a “lower ceiling” for the terminal rate that will be reached prior to the first rate cut.
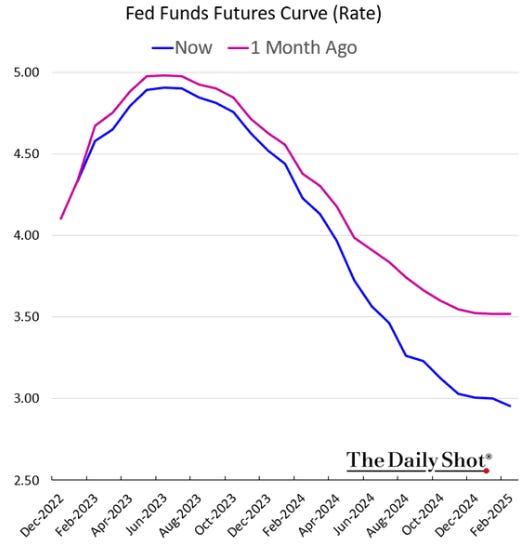
TL;DR — Odds that we see the first rate cut in 2023 are increasing…
Source: United States Bureau of Economic Analysis — Gross Domestic Product, Fourth Quarter and Year 2022 (Advance Estimate).
Source: U.S. Census Bureau — Monthly New Residential Sales, December 2022.
Source: U.S. Census Bureau and U.S. Department of Housing and Urban Development, Monthly Supply of New Houses in the United States [MSACSR], retrieved from FRED, Federal Reserve Bank of St. Louis; https://fred.stlouisfed.org/series/MSACSR, January 27, 2023.
Source: National Association of Realtors — Pending Home Sales Report.
Source: The Daily Shot.