


New Construction Data Supports Those Who Believe We Will Not See A Home Price Crash. | (2.16.23)
“If everything seems under control, you’re not going fast enough.” —Mario Andretti

What You Need To Know This Afternoon:
• The Bureau of Labor Statistics published the latest Producer Price Index (PPI) reading showing that producer inflation increased by 0.7% month-over-month. This reading was much higher than the pre-release market expectation of 0.4%.1 On a year-over-year basis, producer inflation declined from 6.5% in the last report to 6.0% today — the lowest level reached since March 2021 and far below the March 2022 peak of 11.7%. Similar to the CPI reading earlier this week, PPI did decline on a year-over-year basis (which is good), but not by as much as the market had anticipated (hoped) prior to the report. Yet again, inflation proves to be sticky…

TL;DR — Producer inflation declined, but not by as much as the market anticipated.
• Housing Starts and Building Permits both came in below market expectations according to the U.S. Census Bureau for January 2023. Building permits, which measure the annualized number of new residential permits issued during a given month, came in at ~1.34M — below the market forecast of 1.35M.2 Likewise, housing starts, which measure the annualized number of residential buildings that actually began construction (or “broke ground”) in a given month, came in at 1.31M — below the forecasted figure of 1.35M. Ultimately, this data indicates that supply is likely to remain tight in 2023 and should remain below market demand — supporting home prices.

TL;DR — More data to support the currently popular “there will be no crash in home prices” sentiment in the residential real estate market.
• The Department of Labor released the latest initial jobless claims statistics which measure the number of individuals who filed for unemployment insurance for the first time during the past week. According to today’s report, initial claims fell by 1,000 to a seasonally adjusted total of 194,000 for the week ending on February 11th.3 This reading was below the pre-report market forecast of 200,000 and shows the continued resilience of the labor market despite the challenging economic backdrop the U.S. is facing. Alternatively, the “continuing claims” reading came rose by 16,000 reaching 1,700,000 during the same week. This is the highest continuing claims figure since mid-December 2022 and just below the line to make a new one-year high. Essentially, this means that businesses are trying (and somewhat succeeding) to hold onto employees. However, the employees who are let go are struggling to find new work / re-enter the workforce.
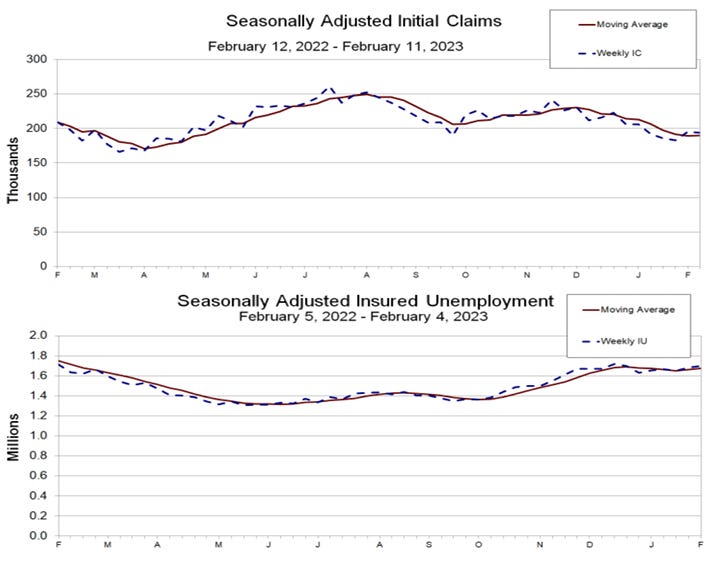
TL;DR — By looking at the relationship between initial jobless claims & continuing claims we can see that there is a slowdown in hiring.
Chart Of The Day:4
Despite surges in consumer prices post-pandemic, Americans are still dining out frequently. In fact, Americans spent $95.5 billion at “food service and drinking businesses” in January 2023 — up 7% from the previous month and 25% year-over-year. Interestingly, the “food and drink sector” has outpaced the post-COVID-19 price increases, with sales up 40% since February 2020 compared to a 19% increase in consumer prices.

TL;DR — Americans just really love dining out.
Source: U.S. Bureau of Labor Statistics — Producer Price Index News Release summary.
Source: U.S. Census Bureau — New Residential Construction.
Source: U.S. Department of Labor — Monthly New Residential Construction, January 2023.
Source: Statista — Americans Won't Let Inflation Spoil Their Appetite.