New Home Sales, Personal Income/Spending, and Record High Apartment Construction To Take You Into The Weekend | (12.23.22)
"You can't build a reputation on what you are going to do." - Henry Ford
What You Need To Know Today:
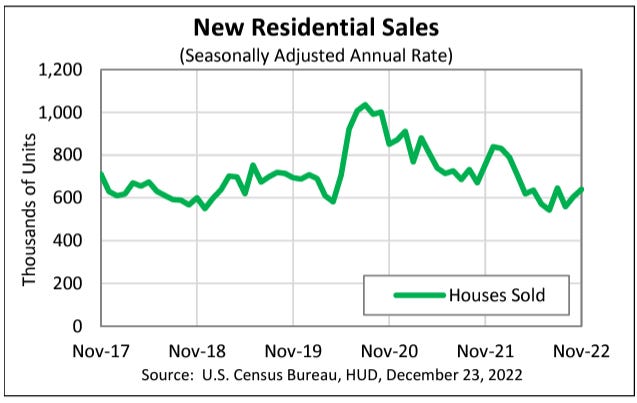
• The U.S. Census Bureau and the Department of Housing and Urban Development, reported that new home sales for “new single-family homes” in the U.S. during November 2022 were at a seasonally adjusted annual rate of 640,000 — above the market expectation of 600,000.1 This is 5.8% above the final October 2022 rate and 15.3% below the same figure in November 2021. Further, the median sales price for new houses sold last month was $471,200. The average came in at $543,600. Lastly, the seasonally-adjusted estimate for the supply of new houses came in at 461,000 —which represents a supply for ~8.6 months of inventory at the current sales rate. It is important to remember that these figures are derived from monthly data and then reported in an annualized format (monthly figure x12).
TL;DR — There were more new homes sold last month than the market expected. Supply/inventory continues to grow — handing some power back to buyers after a very seller-ideal market for the past two years.
• According to the Bureau of Economic Analysis (“BEA”), personal income in the United States increased by $80.1 billion (0.4%) during November 2022 — beating the market forecast of 0.3%.2 This month-over-month (“MoM”) personal income statistic is exactly as it sounds; it measures the change in the total value of income received by all available sources of consumers. Moreover, it is an important figure because income is correlated to spending. More income means more spending and more spending is healthy for the economy (generally). The BEA also released updated MoM “personal spending figures” (PCE), which increased by $19.8 billion (0.1%) — below the market expectation of 0.2%. This means that consumers simultaneously made more money than anticipated and spent less of it.
TL;DR — November 2022 personal income came in higher than expected. Personal spending did the opposite. Typically more income = more spending, but this was not the case.
• The U.S. Census Bureau published updated MoM “durable goods” orders which came in down (-2.1%) — below the pre-release market expectation of (-0.9%).3 For this data, durable goods are defined as “hard products” that have a life expectancy of more than 3 years. This includes things like cars, computers, appliances, and airplanes. This data serves as a leading indicator for future production since increased (or decreased) purchase orders signal what manufacturers’ activity will look like with regard to having (or not having) more orders to fill. By looking at the headline figure, we could determine that the economy is in fact slowing down. However, if we look at the “Core” figure which excludes transportation items MoM durable goods orders came in up 0.2% — beating market expectations of a flat 0.0%. From this perspective, there were signals of growth/positive economic activity for manufacturers. Once again, a single data set paints two different pictures as to whether or not the economy is slowing down or remaining resilient. Remember, the Fed wants to see it slow down (which is why they continue to hike rates) in order to fight inflation. For added context, the core data removes transportation because orders for items like aircraft are volatile and can severely distort the underlying trend. For this reason, most consider the core reading a better gauge of realistic purchase order trends.
TL;DR — Total MoM durable goods orders declined by (-2.1%) in November but were significantly impacted by transportation items. We know this because the core reading came in “up” 0.2%.
Chart Of The Day:
There are currently more apartment units under construction than ever before in the United States. This indicates that we are likely to see both the number of renters grow as well as the proportional number of renters when compared to homeowners. The fear of many is that as we see this trend continue there will be an increased number of “permanent renters” who never become homeowners. That is somewhat of a tragedy from a wealth-building perspective as living spaces for these individuals will remain on the liabilities side of the equation — never moving over to become an asset.
Number of New Apartment Units Under Construction In The U.S.4
TL;DR — We hit a record high for apartment units under construction.
Source: U.S. Census Bureau and the Department of Housing and Urban Development — MONTHLY NEW RESIDENTIAL SALES, NOVEMBER 2022
Source: Bureau of Economic Analysis (BEA) - Personal Income and Outlays, November 2022,
Source: U.S. Census Bureau — Manufacturers’ Shipments, Inventories, & Orders.
Source: U.S. Census Bureau and U.S. Department of Housing and Urban Development, New Privately-Owned Housing Units Under Construction: Units in Buildings with 5 Units or More [UNDCON5MUSA], retrieved from FRED, Federal Reserve Bank of St. Louis; https://fred.stlouisfed.org/series/UNDCON5MUSA, December 22, 2022.


