


Small Businesses Are Not Particularly Optimistic About The Short-Term Future & Individuals Really Should Cut Up Their Credit Cards If They Can | (1.11.23)
“Never let the future disturb you. You will meet it, if you have to, with the same weapons of reason which today arm you against the present.” - Marcus Aurelius, Meditations

What You Need To Know Today:
• The NFIB Research Foundation released updated figures for the NFIB Small Business Optimism Index — which is measured via a survey of small businesses and asks respondents to rate the relative level of economic conditions. These conditions include the labor market, capital spending (expenses), inflation, inventories, sales, earnings, and wages. Moreover, “small business” is defined as a for-profit independent enterprise that employs between 1 and 250 people (excluding owners). This latest reading came at 89.8 which was below the pre-report market expectation of 91.6 as well as the previous monthly reading of 91.9.1 This now marks the 12th consecutive month below the 49-year average reading of 98. Also worth noting, the number of owners expecting business conditions to improve over the next six months declined by eight points month-over-month and inflation remains the single most cited business problem with 32% of owners reporting it as their top concern.
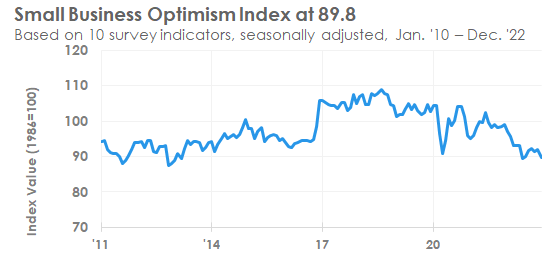
TL;DR — Small-business optimism came in lower than expected marking a full year of readings below the 49-year historical average.
• According to the data from the Federal Reserve, U.S. consumer debt grew in November 2022 by approximately ~$28 billion marking the largest increase in consumer credit over the past three months. This figure came in higher than the market expectation of $25 billion.2 Let’s take a bit of a deeper look into this data… Revolving credit outstanding (including credit cards) represented ~$16.5 (58.9%) of the month-over-month increase whereas non-revolving credit lines such as car loans and student loans, grew by ~$11.5 billion (41.1%). This data is significant because it highlights that despite inflation beginning to ease, its current high levels (relative to the historical average) continue to stress household budgets and lead to Americans increasingly relying on debt (credit cards) to cover their daily expenses. Further, each added dollar of debt taken on in order to cover day-to-day expenses is a dollar taken away from an individual’s debt-to-income (DTI) ratio which hinders their ability to make other big purchases — such as a home. This is particularly impactful for younger adults who as a generation are already struggling to become first-time homeowners. Consumer credit data is reported monthly on a 35-day lag (which is why we’re seeing November 2022 data today) meaning that if the trend continued into December conditions are actually worse today than they appear in this report. Lastly, total consumer credit has now passed pre-COVID-19 levels:3

TL;DR — Consumer debt continues to climb as inflation (despite falling) remains significantly above the U.S. long-term historical average.
Chart Of The Day:
The below data from the AEI Housing Center stood out to me because it highlights an important factor I encourage all to consider when purchasing real estate assets… the relative “buyer pool” based on price point in the specific location that you are looking to purchase. While this might seem obvious, many people do not take the time to factor in what the buyer pool actually looks like for the asset they are looking to purchase/see price appreciation over a multiple-year time period. Simply put, the more expensive price point is not inherently a “better” investment if it is more prone to supply/demand swings than property at the median price point in your area. Price points with larger buyer pools will be considerably more likely to attract multiple offers even if economic conditions deteriorate merely due to the fact that it has a better “demand” profile in the previously mentioned equation. In fact, this is directly highlighted below by the “low” price tier (orange line) out-performing each of the other price tiers AND the overall housing market (including all price tiers).
Home Price Appreciation By Price Tier4

TL;DR — It is important to pay special attention to how your real estate assets stack up against other homes relative to the “real buyer pool” in your given geographic location.
Source: NFIB Research Foundation — Small Business Optimism Index.
Source: Federal Reserve — Consumer Credit Report.
Source: The Daily Shot.
AEI Housing Center research.