


Updated Home Price Index, Consumer Confidence, & Burgernomics. Wait, Burger-What Now?| (1.31.23)
"If you’re not positive energy, you’re negative energy." - Mark Cuban

What You Need To Know Today:
• This morning The Conference Board (CB) released its latest Consumer Confidence Index reading. This index measures the financial confidence of consumers via a survey of approximately 3,000 households — asking them to rate the relative level of both current and (expected) future conditions related to the overall U.S. economy, labor availability, and business conditions. Many market participants keep a close eye on this reading each month as it can serve as a leading indicator for future consumer spending. Today’s reading came in at 107.1, below the pre-release market expectation of 109.1 and last month’s reading of 109.0.1 According to the report, consumers’ sentiment of current business conditions improved month-over-month with 20.2% of respondents noting that current business conditions are “good” — up from 19.2% in December. Moreover, survey respondents also reported a more favorable outlook on the labor market than last month’s report with 48.2% of respondents saying jobs are “plentiful” — up from 46.4%. Overall, this report was “less confident” than the market expected prior to its release and was a net month-over-month decline, but was still positive in multiple aspects and aligns with the consumer spending (pre-COVID-19 levels) that you saw on yesterday’s Homepage.
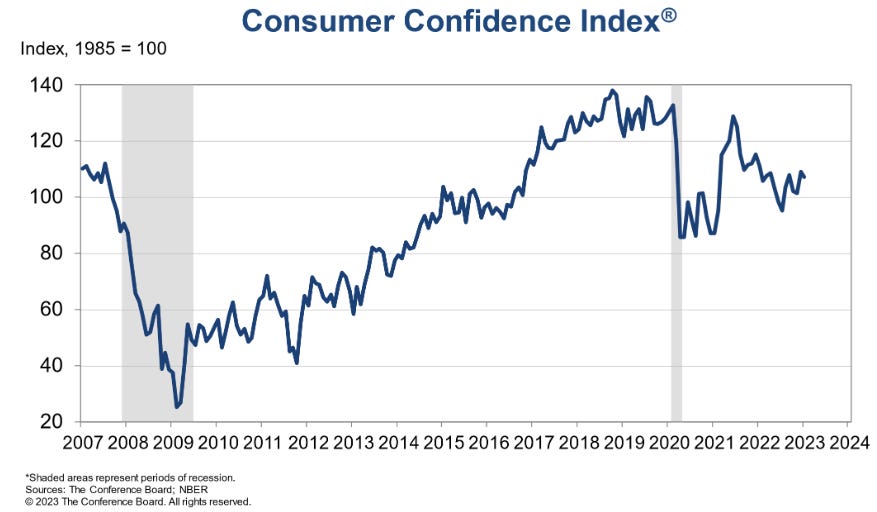
TL;DR — Technically consumer confidence declined month-over-month, but it is not all bad.
• The Federal Housing Finance Agency (FHFA) House Price Index (HPI) fell by (-0.1%) across the U.S. during the month of November 2022 — beating the market expectation of a (-0.4%) decline.2 This index measures the month-over-month change in the purchase price of homes with mortgages backed by Fannie Mae/Freddie Mac and is released monthly with a 60 lag — which is why we are receiving November data today. On a year-over-year basis, home prices rose by 8.2% between November 2021 and November 2022. Essentially, home prices have remained flat since the peaks seen during the summer of 2022 despite fluctuations in mortgage rates suppressing demand. This can largely be attributed to a continued imbalance of inventory keeping supply at bay.


TL;DR — Home prices declined according to the latest FHFA Home Price Index, but remain mostly flat over the past few reports.
• The Federal Open Market Committee (The Fed) will meet today and tomorrow kicking off their 2023 schedule. At the outset of this meeting, the market is expecting the Fed’s hawkish policy to continue with an additional 0.25% (25bps) rate hike. There are some market participants who believe we might see another 0.50% (50bps) hike, but right now that does not seem likely. Either way, check back into The Homepage and I will keep you up to date on the Fed’s next move and how it impacts the real estate & money markets.
Chart Of The Day:3
The Economist’s “Big Mac Index” is more interesting than just measuring the cost of a burger in various countries. It actually serves as a tool to (lightheartedly) determine if various currencies are currently trading at their “correct” level or not. Fundamentally, this index is based on the theory of “purchasing power parity" (PPP) — which is a fancy way of saying that in the long run exchange rates should trend towards a rate that would equalize the prices of identical goods and services in any two countries. In this case, we are talking burgernomics. Here’s an illustration of PPP and how this index can be used as a tool to determine if a currency is over-valued or under-valued relative to another:

So how do various countries stack up according to the Big Mac Index?…..
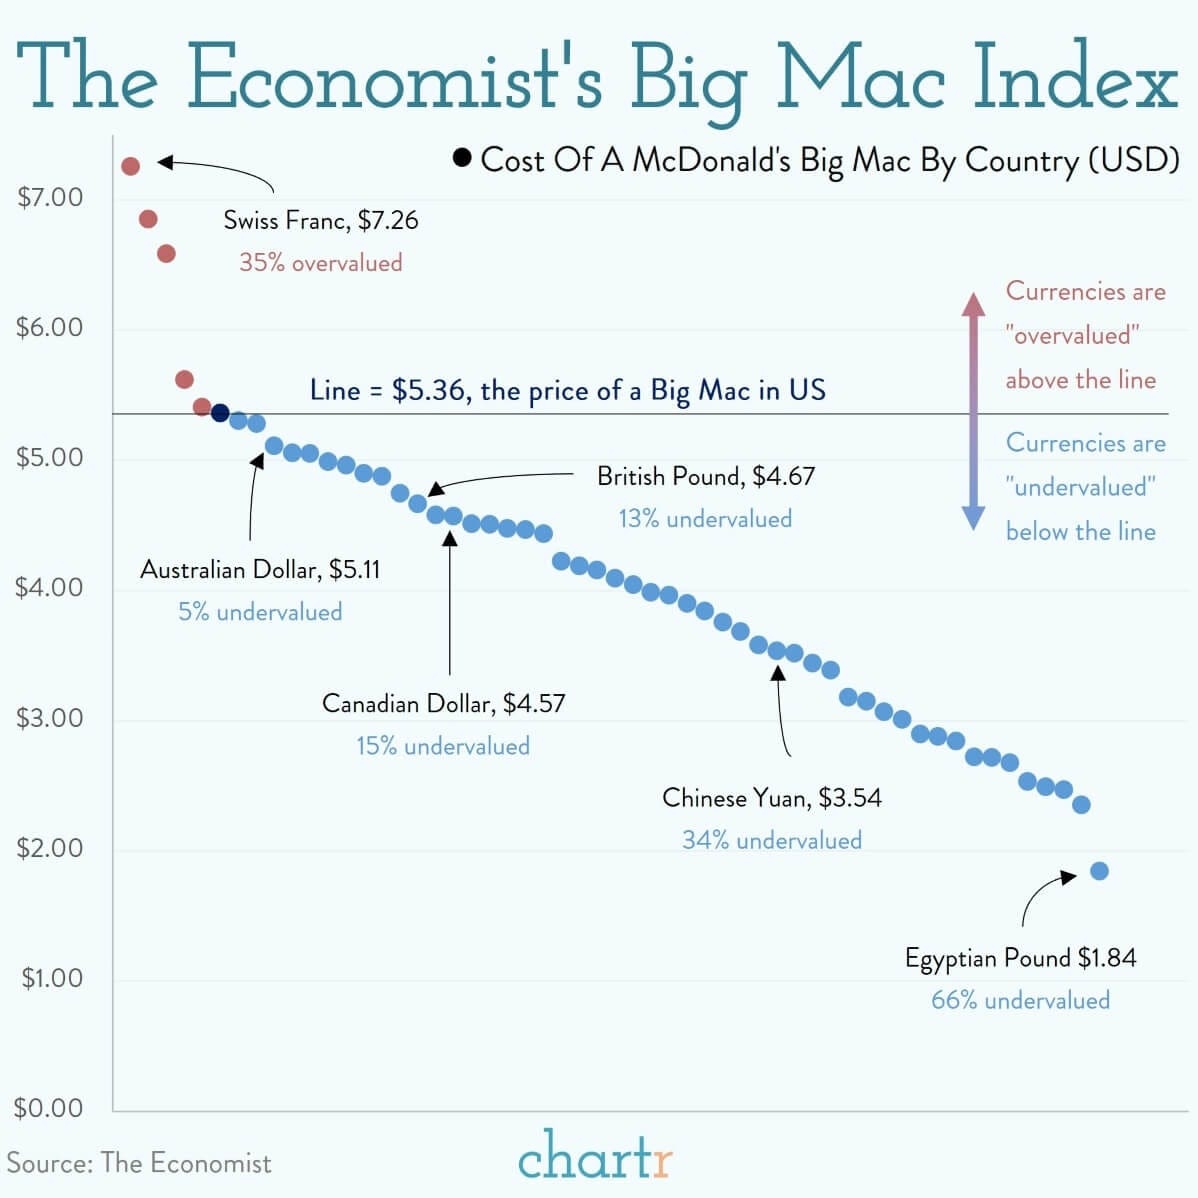
TL;DR — “Burgernomics” are actually fairly useful!
Source: The Conference Board — US Consumer Confidence Declined in January.
Source: Federal Housing Finance Agency (FHFA) — Home Price Index Report.
Source: The Economist & Chartr.